
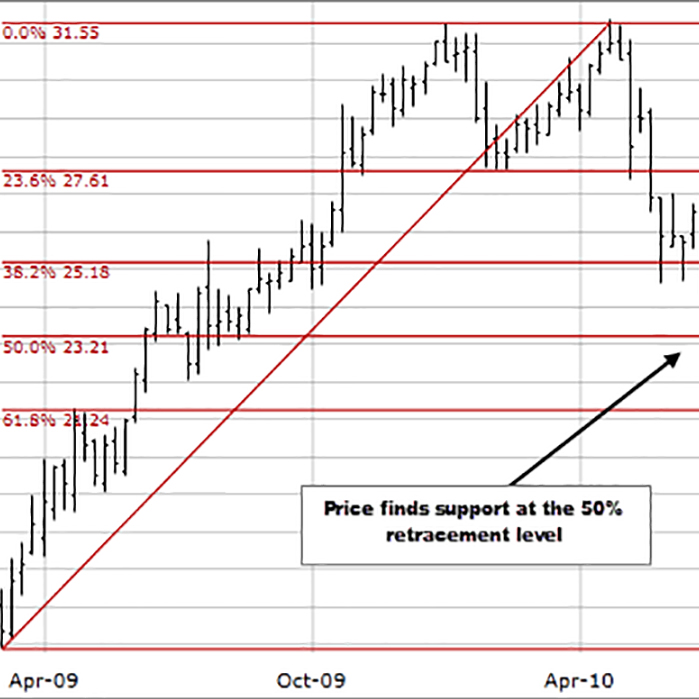
Fibonacci Retracements are ratios used to identify potential reversal levels. These ratios are found in the Fibonacci sequence.
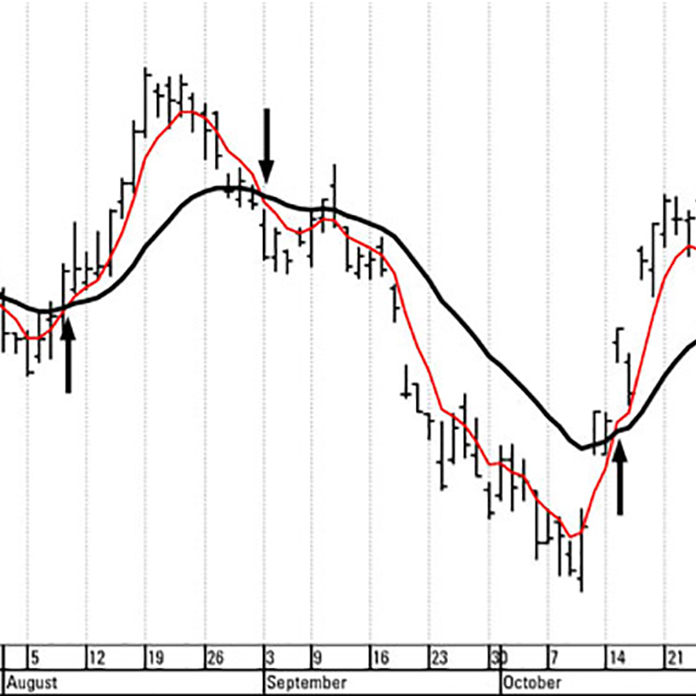
A Moving Average is calculated by adding the closing price for a number of time periods and then dividing this total by the number of time periods.
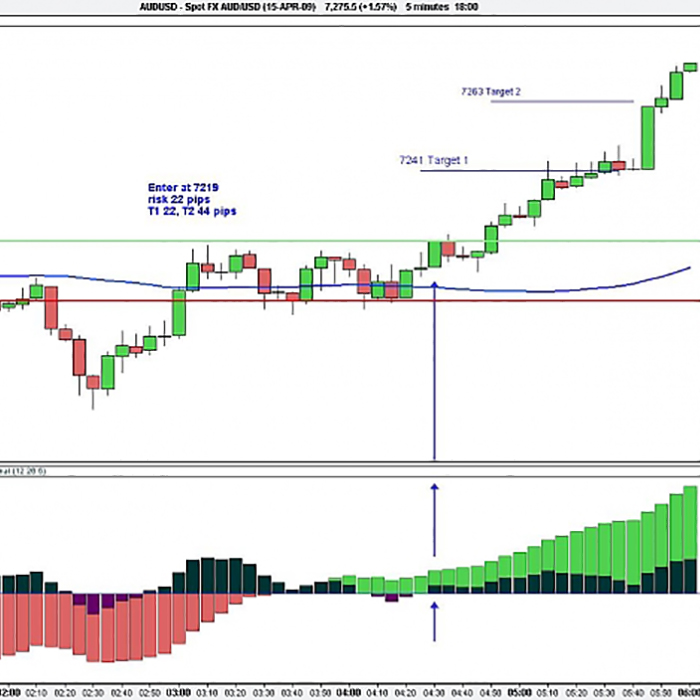
MACD, short for moving average convergence/divergence, is a trading indicator used in technical analysis of prices.
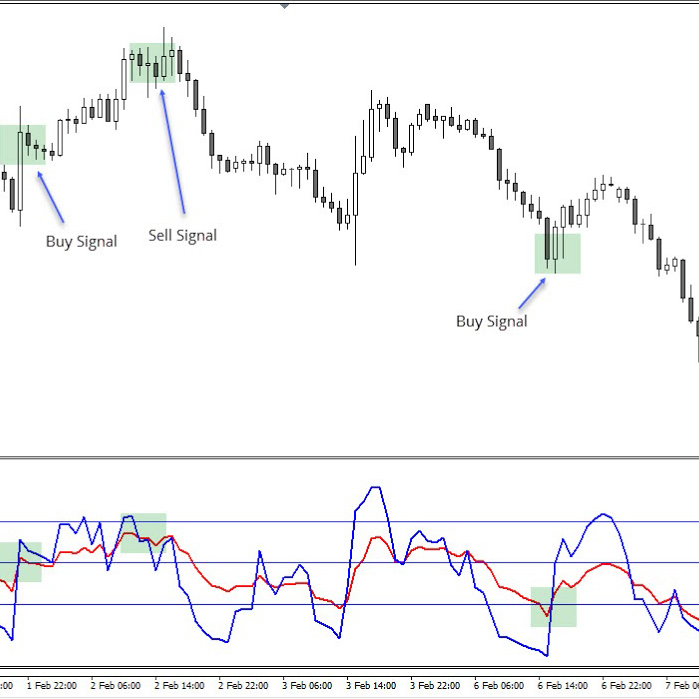
The Relative Strength Index comes in handy when identifying areas that are potentially overbought or oversold.
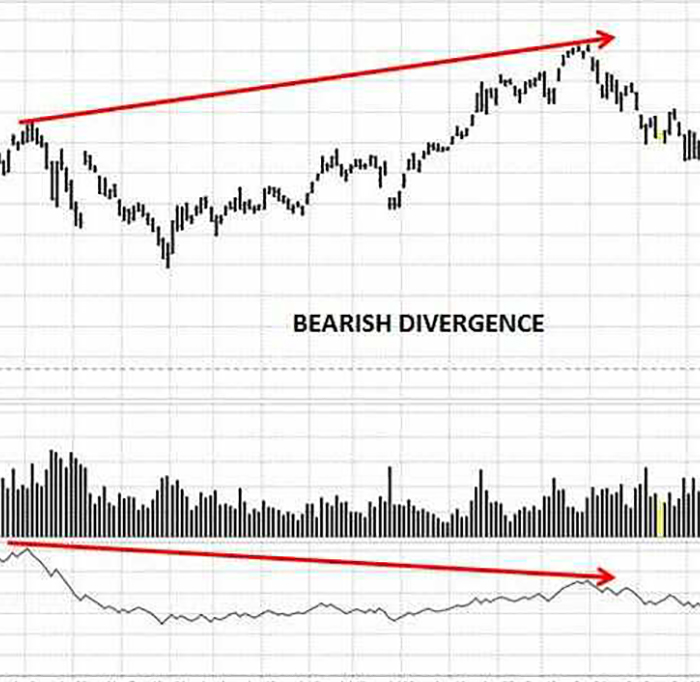
On Balance Volume is a momentum indicator that uses volume flow to predict changes in price.
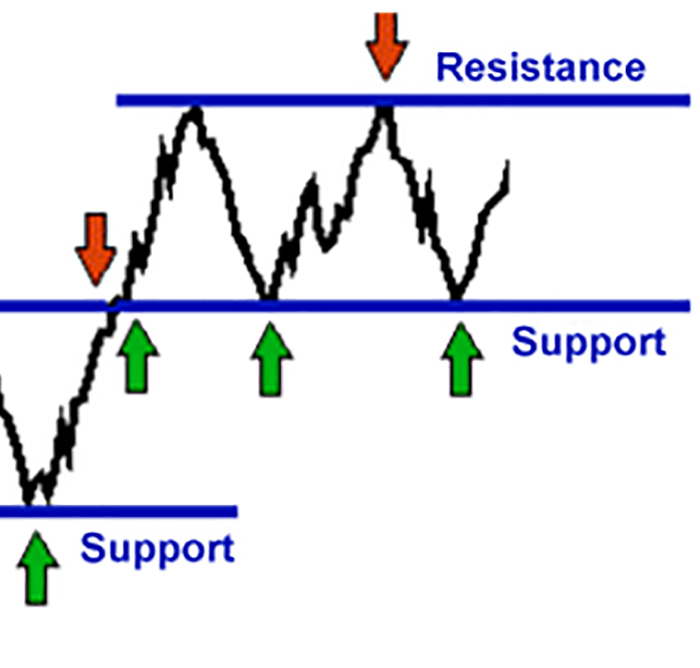
This video will show you how to draw Support and Resistance.